# ── Generative Proof: Evaluation — Sampling, Metrics & Comparison Plots ──
def run_generative_proof_evaluation(
gen_proof_results,
config,
n_eval_samples=1500,
mae_tolerance=0.08
):
"""
Evaluate generative quality of THRML trained on raw outcomes.
Reports mean±std MAE across seeds for marginals and pairwise correlations,
plus pass/fail against a tolerance.
"""
evaluations = {}
infra = build_thrml_infra(config.n_venues, config)
eval_sched = SamplingSchedule(
n_warmup=200,
n_samples=n_eval_samples,
steps_per_sample=config.steps_per_sample
)
serial_blocks = [Block([n]) for n in infra['nodes']]
def sample_model_stats(key, biases, weights):
model = IsingEBM(
infra['nodes'],
infra['edges'],
biases,
weights,
jnp.array(config.beta)
)
prog = IsingSamplingProgram(model, serial_blocks, [])
k1, k2, k3 = random.split(key, 3)
init_state = hinton_init(k1, model, serial_blocks, ())
raw_samples = sample_states(k2, prog, eval_sched, init_state, [], infra['full_block'])[0]
spins = (2 * raw_samples.astype(jnp.float32) - 1).reshape(-1, config.n_venues)
marginals = (jnp.mean(spins, axis=0) + 1) / 2
triu_idx = jnp.triu_indices(config.n_venues, 1)
correlations = ((spins.T @ spins) / spins.shape[0])[triu_idx]
return marginals, correlations
for name, res in gen_proof_results.items():
print(f"\nEvaluating generative quality: {name}")
learned_biases = res['learned_biases']
learned_weights = res['learned_weights']
gt_biases = res['gt_biases']
n_edges = (config.n_venues * (config.n_venues - 1)) // 2
gt_weights = jnp.full((n_edges,), res['gt_correlation_weight'])
baseline_biases = jnp.zeros_like(gt_biases)
baseline_weights = jnp.zeros_like(gt_weights)
key = random.key(99)
k_gt, k_base, k_seed = random.split(key, 3)
gt_marginals, gt_correlations = sample_model_stats(k_gt, gt_biases, gt_weights)
baseline_marginals, baseline_correlations = sample_model_stats(k_base, baseline_biases, baseline_weights)
seed_keys = random.split(k_seed, learned_biases.shape[0])
learned_marginals, learned_correlations = vmap(
lambda b, w, k: sample_model_stats(k, b, w)
)(learned_biases, learned_weights, seed_keys)
marg_mae_per_seed = jnp.mean(jnp.abs(learned_marginals - gt_marginals), axis=1)
corr_mae_per_seed = jnp.mean(jnp.abs(learned_correlations - gt_correlations), axis=1)
marg_mae_mean = float(jnp.mean(marg_mae_per_seed))
marg_mae_std = float(jnp.std(marg_mae_per_seed))
corr_mae_mean = float(jnp.mean(corr_mae_per_seed))
corr_mae_std = float(jnp.std(corr_mae_per_seed))
baseline_marg_mae = float(jnp.mean(jnp.abs(baseline_marginals - gt_marginals)))
baseline_corr_mae = float(jnp.mean(jnp.abs(baseline_correlations - gt_correlations)))
pass_marg = marg_mae_mean < mae_tolerance
pass_corr = corr_mae_mean < mae_tolerance
evaluations[name] = {
'gt_marginals': np.array(gt_marginals),
'gt_correlations': np.array(gt_correlations),
'baseline_marginals': np.array(baseline_marginals),
'baseline_correlations': np.array(baseline_correlations),
'learned_marginals_all': np.array(learned_marginals),
'learned_correlations_all': np.array(learned_correlations),
'learned_marginals_mean': np.array(jnp.mean(learned_marginals, axis=0)),
'learned_correlations_mean': np.array(jnp.mean(learned_correlations, axis=0)),
'marg_mae_per_seed': np.array(marg_mae_per_seed),
'corr_mae_per_seed': np.array(corr_mae_per_seed),
'marg_mae_mean': marg_mae_mean,
'marg_mae_std': marg_mae_std,
'corr_mae_mean': corr_mae_mean,
'corr_mae_std': corr_mae_std,
'baseline_marg_mae': baseline_marg_mae,
'baseline_corr_mae': baseline_corr_mae,
'pass_marg': pass_marg,
'pass_corr': pass_corr,
'mae_tolerance': mae_tolerance,
}
print(f" Marginal MAE (mean±std): {marg_mae_mean:.4f} ± {marg_mae_std:.4f} | pass<{mae_tolerance}: {pass_marg}")
print(f" Correlation MAE (mean±std): {corr_mae_mean:.4f} ± {corr_mae_std:.4f} | pass<{mae_tolerance}: {pass_corr}")
print(f" Untrained baseline MAE: marg={baseline_marg_mae:.4f}, corr={baseline_corr_mae:.4f}")
return evaluations
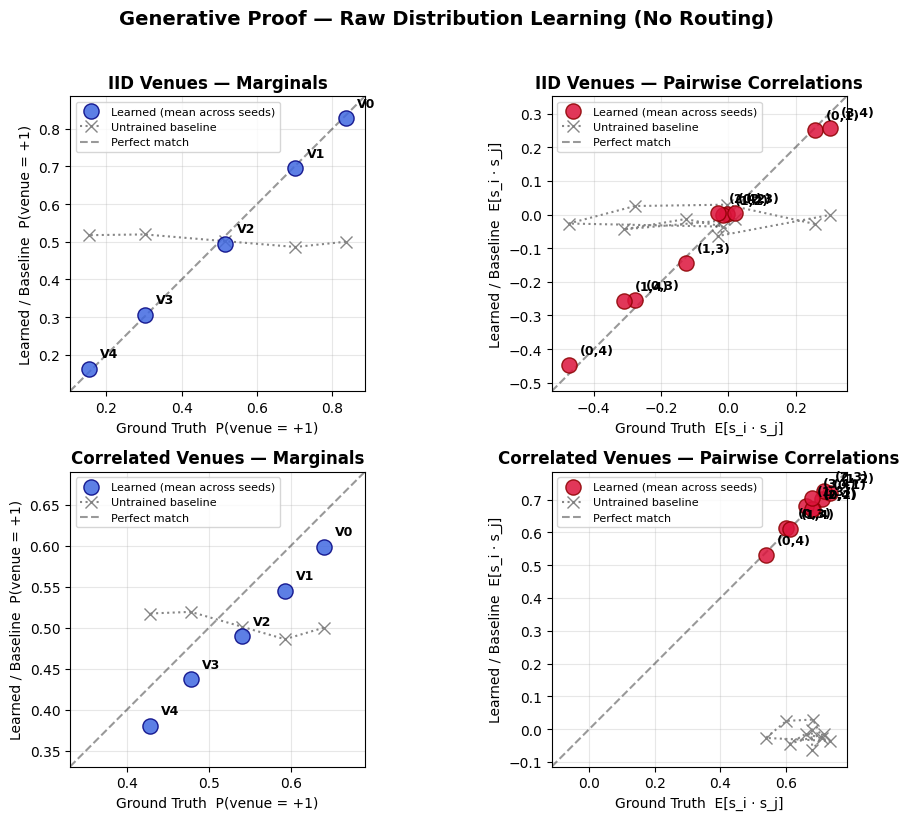
def plot_generative_proof(evaluations):
"""
For each scenario, create a 2-panel plot comparing learned mean vs ground truth,
with an untrained (all-zeros) baseline shown as a dotted reference.
"""
n = len(evaluations)
fig, axes = plt.subplots(n, 2, figsize=(10, 4 * n))
if n == 1:
axes = axes.reshape(1, -1)
for idx, (name, data) in enumerate(evaluations.items()):
learned_m = data['learned_marginals_mean']
gt_m = data['gt_marginals']
baseline_m = data['baseline_marginals']
learned_c = data['learned_correlations_mean']
gt_c = data['gt_correlations']
baseline_c = data['baseline_correlations']
ax = axes[idx, 0]
ax.scatter(gt_m, learned_m, s=120, zorder=3,
c='royalblue', edgecolors='navy', alpha=0.85, label='Learned (mean across seeds)')
ax.plot(gt_m, baseline_m, linestyle=':', marker='x', markersize=8,
color='gray', alpha=0.95, label='Untrained baseline')
pad = 0.05
lo = min(gt_m.min(), learned_m.min(), baseline_m.min()) - pad
hi = max(gt_m.max(), learned_m.max(), baseline_m.max()) + pad
ax.plot([lo, hi], [lo, hi], 'k--', alpha=0.4, label='Perfect match')
ax.set_xlim(lo, hi)
ax.set_ylim(lo, hi)
for i, (x, y) in enumerate(zip(gt_m, learned_m)):
ax.annotate(f'V{i}', (x, y), textcoords='offset points',
xytext=(8, 8), fontsize=9, fontweight='bold')
ax.set_xlabel('Ground Truth P(venue = +1)')
ax.set_ylabel('Learned / Baseline P(venue = +1)')
ax.set_title(f"{name} — Marginals", fontweight='bold')
ax.legend(fontsize=8)
ax.grid(True, alpha=0.3)
ax.set_aspect('equal')
ax = axes[idx, 1]
ax.scatter(gt_c, learned_c, s=120, zorder=3,
c='crimson', edgecolors='darkred', alpha=0.85, label='Learned (mean across seeds)')
ax.plot(gt_c, baseline_c, linestyle=':', marker='x', markersize=8,
color='gray', alpha=0.95, label='Untrained baseline')
lo = min(gt_c.min(), learned_c.min(), baseline_c.min()) - pad
hi = max(gt_c.max(), learned_c.max(), baseline_c.max()) + pad
ax.plot([lo, hi], [lo, hi], 'k--', alpha=0.4, label='Perfect match')
ax.set_xlim(lo, hi)
ax.set_ylim(lo, hi)
n_venues = len(gt_m)
edge_labels = [f'({i},{j})'
for i in range(n_venues)
for j in range(i + 1, n_venues)]
for i, (x, y) in enumerate(zip(gt_c, learned_c)):
ax.annotate(edge_labels[i], (x, y), textcoords='offset points',
xytext=(8, 8), fontsize=9, fontweight='bold')
ax.set_xlabel('Ground Truth E[s_i · s_j]')
ax.set_ylabel('Learned / Baseline E[s_i · s_j]')
ax.set_title(f"{name} — Pairwise Correlations", fontweight='bold')
ax.legend(fontsize=8)
ax.grid(True, alpha=0.3)
ax.set_aspect('equal')
fig.suptitle(
'Generative Proof — Raw Distribution Learning (No Routing)',
fontsize=14,
fontweight='bold',
y=1.02
)
plt.tight_layout()
import os
os.makedirs('images', exist_ok=True)
filename = 'images/generative_proof_results.png'
plt.savefig(filename, bbox_inches='tight', dpi=150)
print(f"\nSaved plot to {filename}")
plt.show()
# ── Run evaluation ──
print("\n" + "=" * 80)
print("GENERATIVE PROOF — Evaluation")
print("=" * 80)
gen_proof_eval = run_generative_proof_evaluation(
gen_proof_results,
gen_config,
n_eval_samples=1500,
mae_tolerance=0.08
)
plot_generative_proof(gen_proof_eval)
print("\n" + "=" * 80)
print("GENERATIVE PROOF — MAE SUMMARY")
print("=" * 80)
print(f"{ 'SCENARIO':<25} | {'MARG_MAE (mean±std)':<24} | {'CORR_MAE (mean±std)':<24} | {'PASS'}")
print("-" * 95)
for scenario_name, data in gen_proof_eval.items():
row = (
f"{scenario_name:<25} | "
f"{data['marg_mae_mean']:.4f}±{data['marg_mae_std']:<14.4f} | "
f"{data['corr_mae_mean']:.4f}±{data['corr_mae_std']:<14.4f} | "
f"{bool(data['pass_marg'] and data['pass_corr'])}"
)
print(row)
print("=" * 95)